Chasing High Corn and Soybean Yields
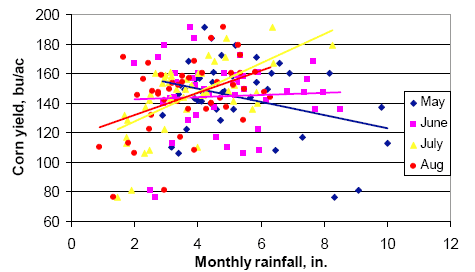
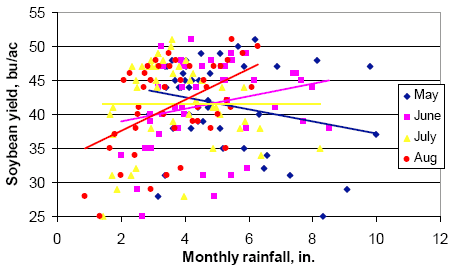
The crop year 2003 was one of the more unusual in recent Illinois history. Producers in the state enjoyed the highest state average corn yield ever—169 bu per acre—but the soybean yield of only 37 bu per acre was the lowest since the drought of 1988. Weather tends to affect corn and soybean similarly; the ratio of statewide corn yield to soybean yield ranged from 2.9 to 3.4 and averaged 3.2 over the decade before 2003. In 2003, this ratio was a whopping 4.6. Because corn yield has varied more than soybean yield, this ratio is more closely associated with corn yield than with soybean yield. When it gets to the extreme level that it did in 2003, it turns our thinking toward yield levels of both crops and reasons why our management "worked" for corn and "didn't work" for soybean. We have to start by realizing that, at least over a period of a few years, weather has a larger effect on yields of corn and soybean than management. This is not to say that management is not important; we need to do everything we can to set crops up to take advantage of favorable weather when we get it. Still, 2003 corn yields were 17 percent higher and 2003 soybean yields were 15 percent lower than the average of the previous five years in Illinois. Management certainly does not change this quickly, at least over the whole state. In a sense, we have probably removed most of the large barriers to yield that can be managed (soil fertility, plant stand, and weeds), so weather remains the only large variable over which we have little control. July and August rainfall amounts still "predict" corn yields better than any other single factor in most years (Figure 1). Soybean yields are more complex, but tend to be associated with August rainfall amounts (Figure 2) in Illinois. SoybeanThe fact that 2003 was a tough year for the soybean crop in Illinois allows us to look at some management factors to see if anything "protected" the crop from the effects of weather, disease (of roots, primarily), and insects, all of which worked together to decrease yields in most areas. The 2003 crop was generally planted somewhat late in most parts of Illinois, and except for some areas that received very heavy rain after planting, most stands were adequate, if not great. The weather continued to be wet in June in most places, and temperatures were lower than average through June and much of July, with a considerable number of cloudy days. Even though the crop seemed to make good canopy growth, it is not certain that root systems were as good as they normally would be by the time flowering started. While flowering was reported to have started on time, podding did not—it was about a week later than normal. By early August, canopy appearance was good, but podding had barely begun, and then it turned dry across almost the entire state. Water use was relatively rapid, but the combination of high demand and compromised root systems, plus some disease and insect pressure, meant that the crop started to run out of water just at the vulnerable time of early podsetting. Pod and seed numbers were reduced, but the full extent of this was not evident until later in August. For many producers, it was not evident until leaves fell, when they saw the low pod numbers and low seed numbers per pod. Other speakers will deal with disease and insect management challenges in soybean in 2003. The following points summarize what we saw in management-related studies in 2003:
Compared to corn, soybean increases yields and yield stability for the corn crop that follows it in the rotation. While corn also has a beneficial effect on soybean yield, it is not clear that one year of corn between soybean crops is enough to provide full "rotational" benefit to soybean. We think that soybean following two or more years of corn or other grain crops may well yield more than soybean following a single year of corn. We believe that is due to the buildup of soybean diseases and nematodes in the soil. Without good genetic resistance to some of these diseases, it may continue to be difficult to manage soybean for higher yields in years when the weather is as uncooperative as it was in 2003. Even so, we need to manage to the best of our abilities in order to have a crop that can take advantage of better weather when we get it. In most years, we do. CornIn most places in Illinois, producers almost had to work at it to get low corn yields in 2003. One whole crop reporting district in Illinois (Central, made up of 11 counties centered roughly on Bloomington) will produce an average corn yield above 190 bushels per acre, and we may see some county yields above 200 bushels per acre for the first time ever. Almost no one saw this coming; the projected yield in the August and September 1 estimates, based mostly on kernel counts, was 154. This jumped to 169 bushels per acre in the October estimate, made after harvest of some fields and thus based on actual yields. This means that much of the "extra" yield came from larger than normal kernel size. Conditions for pollination were good, and pollination occurred at about
the normal time in Illinois: the 50 percent pollination date was July
16 in 2003, only about a day later than the average of the past five
years. Kernel numbers were good, as indicated by the yield estimate of
154 bu per acre, but were not much higher than they have been in other
years. In contrast to 2001, when high kernel numbers could not be filled
as soils dried in August, all indications are that in 2003, the corn
canopy remained active throughout the dry period in August. Otherwise,
grainfill would have ended early, and yields would have been normal or
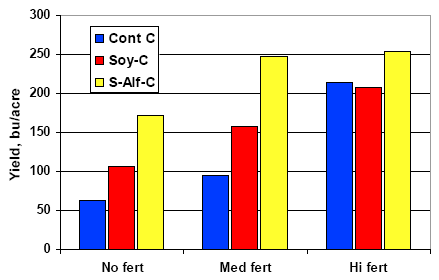
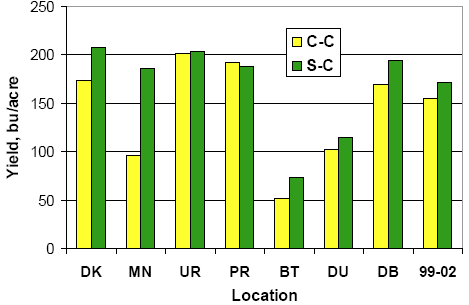
even less than normal. In a year like 2003, almost everything we do "works" to produce high yields, but there were still some instances of yields being increased by management practices. One of these practices was crop rotation. In the Morrow plots on the University of Illinois campus, we saw that corn yields following alfalfa were considerably higher than corn yields following soybean or corn, especially without fertilizer or with only moderate fertilizer (Figure 5). With high fertility, corn following corn yielded as much as corn following soybean in the Morrow plots (Figure 5), and in two of seven sites in Illinois where these two systems were compared (Figure 6). The response to N rate was not much different from what we have seen in recent years, however. Response to plant population also was much like we have seen in the past, though lower populations produced some very large ears and high yields under the conditions in 2003. One of the real questions as we head into 2004 is how to manage corn following corn, especially in areas where soybean yields have been low for two or more years, and where corn yields have been high. This interest is also stimulated by reports from the world-record corn yield producer, Francis Childs of Manchester, Iowa, who produces only corn following corn, and who credits the high amounts of corn residue, as managed by tillage and high N rates, as part of the reason for high corn yields. In continuous corn studies that we initiated at two Illinois locations in 2003, tillage had little effect on yield, additional fertilizer (N, P, and K) increased yield some at Urbana but not at Monmouth, and increasing the population from 32,000 to 40,000 plants per acre actually decreased yield at both locations. Yield levels at Urbana were around 240 bu per acre, but only about 175 at Monmouth, where continuous corn generally fared much worse than corn following soybean (see Figure 6, location "MN"). Some points regarding continuous corn:
Tables & Figures
|
||||||||||||||||||||||
Back to Classic 2004 |

