Managing Given Higher Corn and Soybean Costs
content
 |
Gary SchnitkeyFarm Management Specialist Department of Agricultural and Consumer EconomicsPhone: (217) 244-9595 E-mail: schnitke@illinois.edu |
 |
Dale LattzFarm Management Specialist Department of Agricultural and Consumer EconomicsPhone: (217) 333-0754 E-mail: d-lattz@illinois.edu |
Variable costs have increased dramatically over the past several years, with costs for corn production increasing more than costs for soybean production. Some people have questioned whether management practices should change as a result of these cost increases. In this paper, management responses are framed by first showing how costs have increased in recent years. Then, the following management responses are evaluated: 1) switching acres to growing soybean, 2) reducing tillage passes, 3) sharing combines, and 4) adjusting cash rents.
Variable Cost Increases
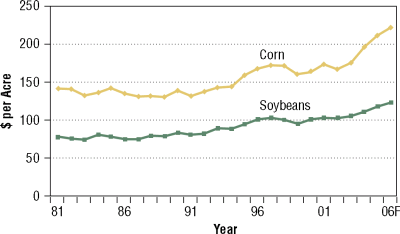
Figure 1 – Per acre variable costs on Illinois FBFM grain farms, 1981–2006F.
Variable costs, which include costs for fertilizer, pesticides, seed, drying, storage, and machinery-related items (i.e., fuel, repairs, and machine hire), were $166 per acre for corn in 2002 for farms enrolled in Illinois Farm Business Farm Management (FBFM). Variable costs for corn are estimated at $221 an acre in 2006, an increase of $55 since 2002. Variable costs for soybeans are projected to be $20 per acre higher in 2006 when compared with costs in 2002. In 2002, variable per-acre costs for soybeans were $103 per acre, and costs in 2006 are projected at $123 per acre.
Recent increases in costs are large by historical standards (Figure 1). Between 2002 and 2006, corn costs have increased an average of $13.75 per acre, compared with an average yearly increase of $1.20 from 1981 through 2002. From 2002 through 2006, soybean costs are projected to increase $5 per acre, compared with an average increase of $1.25 per acre from 1981 through 2002.
Switch to Soybeans from Corn
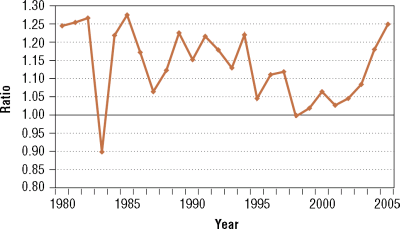
Figure 2 – Corn acres divided by soybean acres, Illinois, 1980–2005.
Because corn costs have increased more than costs for soybeans, one possible response to higher variable costs is to switch acres from corn to soybeans. Growing more soybeans, however, goes against the recent trend of increasing corn acres. In 1998, the ratio of corn acres to soybean acres was 1.00, indicating that there was one corn acre for every soybean acre in Illinois. Since 1998, corn acres have increased relative to soybean acres (Figure 2). The ratio of corn acres to soybean acres was 1.03 in 2002, 1.07 in 2003, 1.17 in 2003, and 1.27 in 2005. To plant more corn acres, farmers have had to plant more corn on farmland that was planted in the previous year to corn. The 2005 ratio of 1.27 corn acres to soybean acres means that for every corn acre that followed soybeans, there was roughly .27 acre of corn following corn in 2005.
Higher variable costs may cause the profitability of corn-after-corn to be questionable, compared with the profitability of soybeans. We calculated revenue less variable costs for corn-after-soybeans, corn-aftercorn, and soybeans for central Illinois farms with highproductivity farmland. Revenues included proceeds from crop sales and loan deficiency payments. Variable costs do not include costs that do not vary with the crop planted, such as land rent, property taxes, depreciation, overhead, interest, and labor. Hence, these returns do not indicate the net profitability of crop production, but show how corn production compares with soybean production.
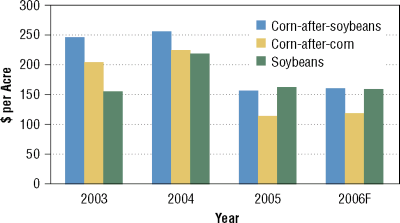
Figure 3 – Revenue less variable costs for corn-after-soybeans, corn-after-corn, and soybeans in central Illinois for farms with high-productivity farmland.
In 2003, corn-after-soybeans had revenue less variable costs of $246 per acre, compared with returns of $204 per acre for corn-after-corn (Figure 3). Returns for corn-after-corn were lower than for corn-after-soybeans because yields were presumed to be 10 bushels less for corn-after-corn, and variable costs for corn-after-corn were higher to account for additional fertilizer needs. In 2003, both corn-after-soybeans and corn-after-corn had higher per-acre returns than soybeans ($153 per acre). In 2004, returns for corn-after-soybeans ($255 per acre) and corn-after-corn ($224) again exceeded soybean returns ($219 per acre).
In 2005, the situation changed, and soybeans were projected to have returns of $162 per acre, higher than returns for corn. Corn-after-soybeans and corn-aftercorn had projected returns of $156 and $114 per acre, respectively. Soybeans had higher returns because 1) variable costs increased less for soybeans than for corn; 2) corn yields were affected more than soybean yields by dry conditions in 2005; and 3) corn prices were below loan rates, whereas soybean prices have been significantly above loan rates.
Projections for 2006 place profitability of cornafter- soybeans and soybeans as nearly equal. Corn-aftersoybeans are projected to have $160 per acre return, and soybeans are projected to have $159 per acre return. Corn-after-corn is projected to have significantly less per-acre return at $117, suggesting that farmers may want to plant soybeans on acres that may have been in cornafter- corn in previous years.
Reduce Tillage Passes
| Operation | Fuel Use | Fuel Costs1 | Total Costs |
|---|---|---|---|
| Primary tillage Chisel Plow Mulch tiller Offset disk V-ripper |
gal/acre 1.3 1.6 1.1 2.4 |
$/acre $3.25 4.00 2.75 6.00 |
$/acre $12.00 15/60 11.20 15.70 |
| Secondary Tillage Field cultivate Mulch finisher Tandem disk |
0.7 0.9 0.7 |
1.75 2.25 1.75 |
6.80 11.20 8.90 |
| Planter | 0.5 | 1.25 | 8.80 |
| Combine Corn Soybeans |
1.8 1.5 |
4.50 3.75 |
32.90 27.80 |
Source: Machinery Costs Estimates publication in management section of farmdoc (www.farmdoc.illinois.edu).
Higher fuel prices focus attention on reducing fuel use. One way to reduce fuel use is to eliminate tillage passes. For example, fuel use for a field cultivator is estimated at 0.7 gallon of diesel fuel (Table 1). Eliminating one pass reduces fuel use by 0.7 gallon per acre. Alternatively, some farmers may reduce primary fuel by reducing deep tillage. For example, switching from using a v-ripper, which requires 2.1 gallons of fuel per acre, to a chisel plow, which requires 1.3 gallons per acre, reduces fuel use (Table 1).
Estimates from FBFM suggest that between 5 and 6 gallons of fuel are used per acre. On northern Illinois grain farms, the average fuel and oil costs per acre were $9.46 in 2001, $8.68 in 2002, $9.78 in 2003, and $12.44 in 2004. Fuel costs are projected at about $15 per acre for 22005. These fuel costs include not only fuel used to complete field operations, but also fuel used for grain hauling and for use in pickup trucks.
Many of the costs associated with machinery are not the costs of fuel. A chisel plow operation, for example, has fuel costs of $3.25 per acre, whereas total costs equal $12.00 per acre (see Table 1). Fuel accounts for only 27% of the total costs of this field operation. Of the operations shown in Table 1, fuel costs account for a low of 13% of total costs (soybean combining) to a high of 38% of total costs (v-ripper). Much of the remaining costs are associated with depreciation and interest, costs that are incurred by owning the machine. Hence, selling tillage equipment or otherwise reducing machinery inventory likely will result in more cost reductions than reducing fuel use.
Controlling Combine Costs
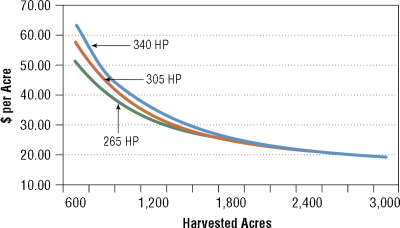
Figure 4 – Costs of combining for three different combines.
Recent advances in harvesting technologies are allowing farmers to harvest more than 3,000 acres of corn and soybeans with one combine. Not using a combine to its capacity often results in higher harvesting costs. Machinery cost estimates prepared in April 2005 for the management section of farmdoc (www.farmdoc.uiuc. edu) indicate that harvesting 1,200 acres results in $31.35 per acre of combine costs for a 265 horsepower combine (Figure 4). Combine costs decreased by $6.05 per acre to $25.20 per acre when 1,800 acres are harvested with a 305 horsepower combine. Costs are $21.65 for 2,400 acres harvested and $19.95 for 2,800 acres harvested when a 340 horsepower combine is used.
Producers on many Illinois farms harvest fewer than 1,200 acres with one combine, and, hence, have high harvesting costs. One possible way of reducing these costs is for two farmers to jointly own a combine. The previous estimates suggest that two farmers who each harvest 1,200 acres have combine costs of $31.35 per acre if each own their own combine. Jointly owning a combine and harvesting 2,400 acres would reduce costs to $21.65 per acre, a savings of $9.70 per acre.
Although entering into a joint ownership arrangement reduces harvesting costs, the parties must agree on a number of factors. Scheduling use of the combine during the time-limited harvest season must be determined when each owner likely desires the use of the combine at the same time. Moreover, determining how to allocate costs between owners can become an issue, particularly when farm sizes change over time. For example, two farmers with 1,000 acres each may have decided to split costs evenly when they purchased the combine. This arrangement will no longer be fair if one farm expands acres to 1,500 acres while the other farm remains the same size. Moreover, deciding when to replace the combine may be difficult. One farmer may wish to replace the combine, and the other farmer may not. Some method for terminating the agreement must be determined.
Adjusting Cash Rents
The aforementioned managerial responses will mitigate some of the variable cost increases. Even if these responses are undertaken, however, variable cost increases will reduce farm profitability. Profit reductions can affect both farm operators and landowners. Under sharerent arrangements, farmers and landlords share in cost increases. In cash rental situations, farmers bear all of the cost increases if cash rents are not reduced. Alternatively, reductions in cash rents allow for sharing the reduction in profitability between the farmer and landlord.
To assess reductions in profitability caused by cost increases, operator and land returns were calculated for northern Illinois using data from grain farms enrolled in Illinois FBFM. The operator and land return represents the amount of funds that are available to split between the operator and land owner under a cash rental agreement. If operator and land return equals $180 and the cash rent is $160, the farmer receives $20 to compensate for labor, equity capital, and management.
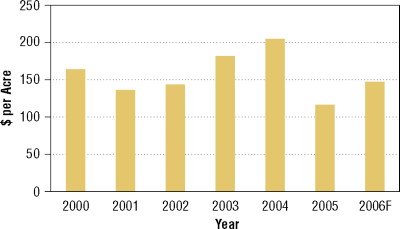
Figure 5 – Costs of combining for three different combines.
During the early 2000s in northern Illinois, operator and land returns were $163 per acre in 2000, $135 in 2001, and $142 in 2002 (Figure 5). Profitability increased in 2003 and 2004, resulting in operator and farmland returns of $180 per acre in 2003 and $209 per acre in 2004. Because of lower corn yields and higher costs, returns are projected to decrease in 2005 to $115 per acre. Forecasts for 2006, using 5-year average yields and commodity prices based on futures markets, indicate an operator and land return of $146 per acre.
Forecasted 2006 returns are in the range of early 2000 returns. Because of cost increases, the profitability of the agricultural sector has moved from fairly high profits during 2003 and 2004 to a period of lower profits. There are scenarios that would result in 2006 profits above those projected. However, even if yields and prices were the same in 2006 as they were in 2004, returns in 2006 would be lower because of higher costs. Moreover, combination of low yields or lower prices could result in lower 2006 returns than those projected in Figure 5.
Summary
Increases in variable costs from 2002 through 2006 have been large by historical standards, which may cause a switch from corn acres to soybean acres. Other management responses to increasing variable costs include a reduction or change in tillage practices and sharing combines. Ultimately, these responses will not totally counter the increases in variable costs, and profitability in the agricultural sector will be reduced, which may lead to the need to reduce cash rents in the future.