Can We Rotate Our Way to Higher Crop Yields?
 |
Darrel GoodProfessor and Extension Economist Department of Agricultural and Consumer EconomicsPhone: (217) 333-4716 E-mail: d-good@illinois.edu |
One of the most important factors in determining the price of corn and soybeans is the size of the U.S. crops. The U.S. is the largest producer of both crops, accounting for more than 40 percent of world corn production and nearly 40 percent of world soybean production. As a result, U.S. corn exports account for 60 percent of the world corn trade, and U.S. soybean exports account for 45 percent of the world soybean trade.
Uncertainty about the size of the U.S. crop during the growing season can create significant price volatility. In 2005, for example, December 2005 corn futures traded above $2.70 in mid-July on thoughts that corn production would be reduced significantly due to poor growing conditions, particularly in Illinois. By the end of harvest, however, December corn futures traded under $1.95 per bushel as the average U.S. yield turned out to be very near the trend value. Similarly, November soybean futures traded above $7.70 in mid-June, but declined to about $5.75 as harvest of a large crop, with a record U.S. average yield, was completed.
The average U.S. and Illinois corn and soybean yields in 2005 have been widely characterized as "surprisingly large," with some people suggesting that a major technological breakthrough was manifested in 2005. Do the data support such a conclusion? Were average yields significantly higher than would have been expected based on reports of crop conditions during the growing season and on actual state average weather conditions during the growing season?
Correlation of Crop Conditions to Average U.S. Yields
During the growing season, the National Agricultural Statistics Service of the USDA releases a weekly report of the condition of the crops for 18 states and for the U.S. The report indicates the percentage of the crop rated as very poor, poor, fair, good, and excellent. The procedure for collecting and reporting these data, as outlined in those reports, follows:
"Survey Procedures: Crop progress and condition estimates are based on survey data that are collected each week from early April to the end of November. The Crop progress and condition surveys are nonprobability surveys that include a sample of more than 5,000 reporters whose occupations provide them opportunities to make visual observations and frequently bring them in contact with farmers in their counties. Based on standard definitions, these reporters subjectively estimate progress of farmers' activities and progress of crops through their stages of development. They also provide subjective evaluations of crop conditions.
"Most reporters complete their questionnaire on Friday or early Monday morning and submit it to the Agricultural Statistics Service's office in their State by mail, telephone, fax, e-mail, or through a secured internet website. A small number of reports are completed on Thursday, Saturday, and Sunday. Regardless of the time that the questionnaire is completed, reporters are asked to report for the week ending on Sunday. For reports submitted prior to the Sunday reference date, a degree of uncertainty is introduced into the projections for weekend progress and crop condition changes. By the end of the 2001 season, nearly two-thirds of the data were being submitted through the internet website. As a result, about one-half of all data are submitted on Monday morning, which has significantly reduced this projection uncertainty.
"Reporters are sent written reporting instructions at the beginning of each season and are contacted periodically to ensure proper reporting. Terms and definitions of crop stages and condition categories that are used as reporting guidelines are available on the National Agricultural Statistics Service (NESS) website.
"Estimating Procedures: Reported data are reviewed for reasonableness and consistency by comparing with data reported the previous week and data reported in surrounding counties for the current week. Each State Statistical Office summarizes the reported data to district and State levels, weighting each county's reported data by NASS county acreage estimates. Summarized indications are compared with previous week estimates, and progress items are compared with earlier stages of development and historical averages to ensure reasonableness. Weather events and reporter comments are also taken into consideration. State estimates are submitted to the Agricultural Statistics Board (ASB) along with supporting comments, where they are compared with surrounding States and compiled into a National level summary by weighting each State by its acreage estimates." [Source: Weekly Weather and Crop Bulletin, NASS, USDA]
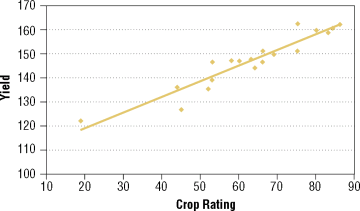
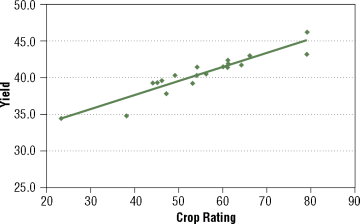
Although the data in these reports are highly subjective, market participants follow these reports closely to get an indication of yield potential. The weekly data have been available for the U.S. since 1986. Over the period 1986 through 2004, there has been a strong correlation between the percentage of the crop rated good or excellent in the last report of the season and the trend adjusted U.S. average yield of corn and soybeans. For the period 1986 through 2004, those relationships for corn and soybeans were as follows:
- trend adjusted corn yield = 105.65 + 0.6567 (percent of crop rated good or excellent)
- trend adjusted soybean yield = 29.786 + 0.1941(percent of crop rated good or excellent)

Figure 1 –Relationship between crop rating
and trend adjusted U.S. corn yields.

Figure 2 –Relationship between crop rating
and trend adjusted U.S. soybean yields.
The percentage of the crop rated good or excellent at the end of the season explained 89 percent of the annual variation in trend adjusted average U.S. corn yields and 87 percent of the annual variation in trend adjusted average U.S. soybean yields (Figures 1 and 2).
For 2005, the season ended with 57 percent of both the corn and soybean crops rated in good or excellent condition. Those ratings suggested a U.S. average corn yield of 143.1 bushels per acre, 3.6 percent below the USDA's November estimate of 148.4 bushels per acre. The ratings suggested a U.S. average soybean yield of 40.8 bushels per acre, 4.4 percent below the USDA's November estimate of 42.7 bushels. The poorest rating of the season for corn was 50 percent good or excellent for the week ended on August 21. At the lowest point, then, crop conditions suggested a U.S. average yield of corn of 138.5 bushels per acre, very near the August estimate of 139.2 bushels per acre. For soybeans, the poorest rating (51 percent good or excellent) was recorded for the weeks ended August 7 and 14. Those ratings suggested an average U.S. yield of 39.7 bushels per acre, one bushel above the August estimate. At no time during the growing season did U.S. crop ratings suggest an extremely poor U.S. average yield of either corn or soybeans. At the peak of summer prices (mid-July for corn and mid-June for soybeans), crop condition ratings suggested an average corn yield of 141.8 bushels per acre and an average soybean yield of 41.4 bushels per acre.
Comments from market participants as USDA yield forecasts and harvest results became available in 2005 indicated that they had lost confidence in the USDA's report of crop conditions as a useful indicator of yield potential. As an example, this quote is from a popular agricultural web site: "The new varieties of corn are just more drought tolerant, so the corn crop may not look all that great it just yields. So, the models to figure yields based on crop condition just didn't work this year." Although average yields in 2005 were higher than forecast by the crop condition models, the relationship between average yield and crop condition rating at the end of the season in 2005 was well within the experience since 1986. At least on a national basis, the report still seems to provide very useful information about yield potential.
Correlation of Illinois Average Yields to Trend and Weather

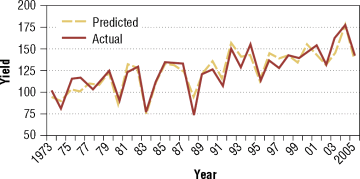
Figure 3 – Predicted and actual Illinois average corn yields.

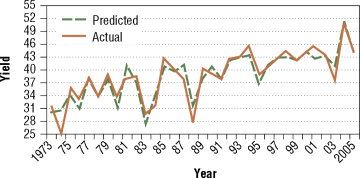
Figure 4 – Predicted and actual Illinois average soybean yields.
In 1963, L. M. Thompson of Iowa State University released the results of a study that correlated state average corn and soybean yields to a trend variable and preseason and growing season weather variables. [Thompson, L. M. 1963. Weather and Technology in the Production of Corn and Soybeans. The Center for Agricultural and Economic Development, Iowa State University, Report 17 (1963)]. We have re-estimated the models presented in that study for the period 1973 through 2005 for Illinois (Figures 3 and 4). Specifically, the models correlate the state average yield to trend, total preseason precipitation (September through May), state average monthly precipitation from June through August, and state average monthly temperatures from May through August. The trend variable (entered as year, 1973….2005) captures the impact of technological and management factors that have increased average yields over time. For Illinois, the model explains 88 percent of the annual variation in state average corn yields and 86 percent of the annual variation in state average soybean yields from 1973 through 2005. We found similar results for Iowa.
In particular, the model estimates that the trend increase in the Illinois average corn yield has been 1.76 bushels per acre per year since 1973. In addition to trend, July temperature and precipitation and August temperature have the largest and statistically most significant impact on the state average yield. This is consistent with expectations. The model suggested a 2005 average Illinois corn yield of 140.7 bushels per acre, 4.3 bushels below the USDA's November estimate. The soybean model indicates that the trend increase in the state average yield has been 0.45 bushel per acre per year since 1973. In addition to trend, July precipitation and August precipitation and temperature have the largest and statistically most significant impact on the state average soybean yield. The model suggested a 2005 average yield of 44 bushels per acre, 2 bushels less than the USDA's November estimate. Like the crop condition model, the weather based model for Illinois underestimated 2005 yields, but the accuracy was within the experience of the past 32 years.
The success of models that explain corn and soybean yields varies with the time period studied. At least for average Illinois corn and soybean yields, however, trend and the logical summer weather variables go a long way toward explaining yield patterns of the past three decades, including 2005.
Conclusions
The results of the two types of analysis reported here indicate that U.S. and Illinois average corn and soybean yields in 2005 were higher than expected given the USDA's report of crop conditions and state average growing season weather conditions. Although yields were higher than suggested by the models, the magnitude of the unexplained yields was well within the historic experience. In short, average yield forecasts as reported by USDA from August through November 2005 should not have been a major surprise to market participants. To the extent that U.S. yields exceeded expectations, the source for the forecast was primarily Iowa, rather than Illinois. State average yields in Iowa exceeded the weather model projections by 17 bushels per acre for corn and 5 bushels per acre for soybeans.