How Much N Do You Need? Is 1.2 Right for You?
 |
Robert HoeftProfessor of Soil Fertility ExtensionPhone: (217) 333-4424 E-mail: rhoeft@illinois.edu |
||
Increasing fertilizer cost along with continual concern about the negative impact of nitrogen on environmental quality requires that N rate recommendations be based on the best data available. To that end, scientists from Illinois, Indiana, Iowa, Minnesota and Wisconsin have begun the process to develop a unified N recommendation system based on the combined data from all states.
N Recommendation History
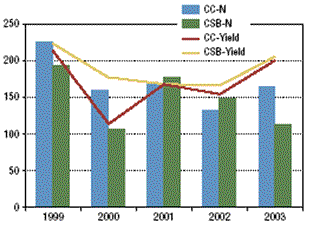
Historically, Universities in many of the Cornbelt States have used a yield goal based factor for continuous corn, with adjustments for previous legume crop. These recommendations were derived from experimental data collected in the late 60s and early 70s. More recent data has in some cases confirmed these original factors, but in other cases, the research has identified a poor correlation between individual site-year corn yield and optimum N (Figure 1) and that optimum N on a given soil does not change with change in yield. Recognizing this problem, some states have shifted to recommendations based on soil type. Current recommendation systems used by the above listed states are quite diverse in process, but surprisingly, relatively close in end result (Table 1). The biggest differential occurred on low organic matter, low yield potential soils.
The extreme variability in optimum N rates observed from one year to the next clearly demonstrates that there are several factors, some of which cannot be controlled or predicted in advance of the crop year, that influence optimum N rate. Keeping this in mind, one must accept that it is unlikely that any recommendation system will accurately predict N need for all fields in all years or in many cases that it will precisely predict the optimum N rate in any field in any year.
The best N recommendation system will:
- minimize economic loss–loss associated with purchase of more product than needed or loss associated with underapplication and consequently loss of yield potential
- minimize potential for environmental contamination
- be risk averse—one must develop a system that will insure producers that even in the most N demanding year, there will be minimal yield loss associated with the N recommendation
- be based on research data collected under environments and soil types similar to those of the area
The current recommendation system:
(Proven yield continuous corn bu/acre × 1.2 lbN/bu) – legume
credit – manure credit – credit for incidental N
has been in effect in Illinois since the 1975 crop year. Since its development,
several things have changed. The ratio of acres of corn to soybean has
gone from 1.45 to 1.01, crop yields have risen by over 50 percent, tillage
has been substantially reduced, and statistical techniques available
to analyze the data have improved.
The data used to develop the original recommendations may have been biased upward as:
- much of the original data was developed from continuous corn experiments, which was appropriate at the time as a significant portion of Illinois corn was following corn, but not as appropriate for cornsoybean rotations.
- many of the experiments were long term studies which would tend to show larger yield differences due to the application of N since the control plots would likely have been more depleted of N than would be the case in farmers fields in the 21st century. Some also suggest that results obtained from larger plots in farmer's fields are more reliable than those from small plots on research farms. Minnesota data does not substantiate that assertion.
- the N source for most of this older data was ammonium nitrate, a form of fertilizer N more susceptible to loss by denitrification and leaching. Such enhanced loss would also inflate the optimum N level.
New Recommendations
In recent years, new N response data has been collected under both continuous corn and corn-soybean rotations; at research centers and on farmer fields at locations representative of the major soil areas of the state; and using nitrogen materials and application techniques that will minimize N loss.
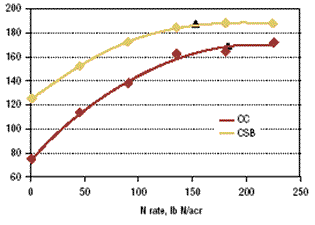
When data from these recent studies were combined over years and locations, the results confirm that use of the old N recommendation system effectively predicted optimum N need (Figure 2). For continuous corn, a yield of 154 bu/acre was obtained at the optimum N rate of 171 lb N/acre, a coefficient of 1.1 lb N/acre. For corn after soybean, the optimum N level was 133 lb N/acre, a level approaching the 40 lb N/acre credit suggested for soybean for many years. However, since corn after bean yields averaged 8 percent more than corn after corn, use of the old recommendation system with corn after soybean yield data would have resulted in an overapplication of approximately 30 lb N/acre.
Further evaluation of the data from individual locations confirmed that the base factor for continuous corn was close to the old data for central and northern Illinois, ranging from 1.0 to 1.2 (Table 2), but low for most southern Illinois soils (Table 3). Soils of lower yielding potential required more supplemental N per unit of grain production. For corn after soybean, the current N recommendation system substantially over recommends N in central and northern Illinois and under recommends for soils with lower yield potential, particularly in southern Illinois.
As pointed out earlier, the year–to–year variation in optimum N, measured as pounds per acre or pounds per bushel is substantial. Since this variation is not predictable, much work needs to be done to develop the N recommendation system that will meet the criteria set forth for an ideal N recommendation system.
Tables & Figures
| Table
1. Diversity of N recommendations within Midwestern states. |
||||
|---|---|---|---|---|
Field Properties |
||||
| State | 3.5% O.M. 150 bu/acre Continuous Corn |
2.0% O.M. 120 bu/acre Continuous Corn |
||
N lb/acre |
||||
| Illinois | 180 |
144 |
||
| Indiana | 177 |
136 |
||
| Iowa | 175 |
175 |
||
| Minnesota | 160 |
130 |
||
| Wisconsin | 160 |
120 |
||
| Table 2. Variation in N need by location–Cental and northern Illinois. | |||||
|---|---|---|---|---|---|
| Rotation | Opt. N Lb/Acre |
Opt. Y Bu/Acre |
Lb N/ bu Y | ||
| Dekalb | Cc |
191 |
162 |
1.2 |
|
Sc |
118 |
179 |
0.9 |
||
| Monmouth | Cc |
163 |
158 |
1.0 |
|
Sc |
119 |
199 |
0.8 |
||
| Urbana | Cc |
182 |
169 |
1.1 |
|
Sc |
153 |
187 |
1.0 |
||
| Perry | Cc |
154 |
40 |
1.1 |
|
Sc |
113 |
138 |
1.1 |
||
| Table 3. Variation in N need by location–southern Illinois. | |||||
|---|---|---|---|---|---|
| Rotation | Opt. N Lb/Acre |
Opt. Y Bu/Acre |
Lb N/ bu Y | ||
| Brownstown | Cc |
215 |
86 |
2.5 |
|
Sc |
168 |
70 |
3.0 |
||
| Dixie Springs | Cc |
170 |
104 |
1.6 |
|
| Upland | Sc |
123 |
112 |
1.5 |
|
| Dixie Springs | Cc |
149 |
141 |
1.1 |
|
| Bottoms | Sc |
140 |
157 |
1.1 |
|
 |
Figure 1. Varition
in optimum N and yield over time. |
 |
Figure 2. N response over 34
environments, 1999–2003. |