More Corn and Fewer Soybeans: Does It Pay?
 |
Gary SchnitkeyFarm Management SpecialistPhone: (217) 244-9595 E-mail: schnitke@illinois.edu |
 |
Dale LattzFarm Management SpecialistPhone: ((217) 333-0754 E-mail: d-lattz@illinois.edu |
|
In the past few years, corn returns have increased relative to soybean returns, causing some to ask whether planting more corn acres should be considered. In this paper, we evaluate whether a switch from soybean acres to corn acres is advisable. This is accomplished by first comparing corn returns to soybean returns from 1996 through 2004. This comparison indicates that high corn yields relative to soybean yields are the primary factor causing an increase in corn returns. Then a budgeting exercise is used to compare profits from alternative corn-soybean rotations.
Historic Profitability of Corn and Soybeans
Illinois Farm Business Farm Management (FBFM) Associations records are used to summarize returns from corn and soybean production for Illinois grain farmers by computing per acre revenue less variable costs, hereafter referred to as returns. Revenue contains all items that vary directly with the crop planted including crop revenue (yield times market price) and farm program loan deficiency payments. Not included are items that do not vary with the crop planted such as direct and countercyclical farm program payments. Variable costs include fertilizer and lime, pesticides, seed, drying and storage, machinery repair and hire, and fuel costs. Not included are costs that do not vary directly with the crop planted such as machinery depreciation, labor, and land costs.
Corn and soybean returns are calculated for the northern, central, and southern regions. The central Illinois region is further broken down into high productivity farmland (173 bushel five-year average corn yield) and low productivity farmland (164 bushel yield) categories. Detailed breakdowns of revenue, variable costs, and returns for the four categories are reported in the management section of farmdoc.
Figure 1 shows corn returns minus soybean returns from 1996 through 2003 for the four categories. Also included are preliminary returns for 2004 and a projection for 2005 based on five-year average yields, prices slightly above loan rates, and variable costs adjusted to reflect 2005 conditions. Positive numbers indicate that corn is more profitable than soybeans while negative numbers indicate the opposite.
Since 1997, corn returns have increased relative to soybean returns. In the northern region, for example, corn return minus soybean return was −$38 in 1997. In 1998 and 1999, the difference was close to zero, $9 in 1998 and −$8 in 1999. The difference was positive in 2000, 2001 and 2002; $26 in 2000, $10 in 2001, and $34 in 2002. The difference then became very positive, $94 in 2003 with a preliminary estimate of $72 for 2004. For 2005, the difference between corn and soybean return is projected at $51 per acre.
Factors Contributing to Increasing Corn Returns
The most important factor contributing to increasing corn returns are high corn yields relative to soybean yields. In Illinois, the corn-soybean yield ratio (corn yield divided by soybean yield) has averaged 3.2 from 1972 through 2004 (Figure 2). Since 2000, the yield ratio has been above 3.2 in all years except 2002. Even in 2002, the northern and western portion of the state had high corn yields relative to soybean yields. The 2002 Illinois yield ratio was below average because of low ratios in southern and eastern Illinois. In 2003, the yield ratio hit an alltime high of 4.56. Illinois yields in 2004 were at record high levels for both corn and soybeans (180 bushels for corn and 50 bushels for soybeans). Even though soybean yields were at record levels, the corn-soybean yield ratio still favored corn. The 2004 yield ratio was 3.6, the second highest ratio on record.
Partially offsetting high corn yields are increases in variable costs. Variable costs increased faster for corn than for soybeans. In northern Illinois, for example, corn variable costs increased from $164 per acre in 1999 up to $189 in 2004, an increase of $25 per acre. During the same period, soybean variable costs increased $9 per acre ($103 in 1999 up to $112 in 2004). These relative increases favor soybean production; however, relatively high corn yields more than offset cost increases.
2005 Budgets
Historical increases in the profitability of corn relative to soybeans do not necessarily indicate that more acres should be shifted to corn. Using 2005 crop production budgets, one can examine whether an increase in corn acres is justified. Complete budgets can be found in an Illinois Farm Economics: Facts and Opinions article entitled "2005 Corn and Soybean Revenue and Cost Estimates," which is available for download from the management section of farmdoc.
Table 1 is a summary of these budgets for central (high productivity farmland) and southern Illinois. For central Illinois, the yield for corn-after-soybeans is 173 bushels per acre, equal to the five-year average yield for central Illinois with high productivity farmland. Price per bushel is $2.25 and is based on futures prices during late 2004. Variable costs of $192 are composed of $65 for fertilizer and lime, $40 for pesticides, $38 for seed, $16 for drying and storage, and $33 for machinery repair, fuel, and hire costs.
The 156 bushel yield for corn-after-corn is 10% lower than the corn-after-soybeans yield (Table 1). The 10% reduction is based on a compilation of agronomic research that finds that corn-after-corn has lower yields than corn-after-soybeans. In addition, variables costs for corn-after-corn are projected $10 higher than variable costs for corn-after-soybeans to account for higher nitrogen costs. Revenue less variable costs for corn-aftercorn is $149 per acre, $48 lower than the return for cornafter- soybeans.
Corn-after-corn return is slightly higher than the soybean return of $144 per acre. The soybeans returns of $144 per acre is based on a 49 bushel per acre yield (fiveyear average for central Illinois−high quality farmland), a $5.20 per bushel soybean price (based on future prices in late 2004), and $111 of variable costs. Variable costs are composed of $24 of fertilizer, $25 of pesticides, $29 of seed, $5 of drying and storage, and $28 of machine repair, fuel, and hire costs.
While corn returns are higher, the budgets in Table 1 do not necessarily suggest a shift to more corn is advisable. Many farms in northern and central Illinois utilize a corn−soybean rotation in which corn follows soybeans and vice versus. Because corn-after-corn has a higher return than soybeans, the central Illinois budgets in Table 2 suggest that moving from a corn−soybean rotation to more corn may be more profitable in the first year. However, after the first year, moving to more corn may not be more profitable because more corn-after-corn will need to be planted.
This can be seen by computing a weighted average per acre return for different rotations. If a 1/2 corn − 1/2 soybean rotation is applied continuously over time, 1/2 the average return comes from corn-after-soybeans and 1/2 from soybeans, resulting in an average return of $171 per acre (1/2 × $197 corn-after-soybean return + 1/2 × $144 soybean return). A typical rotation when moving to more corn is a 2/3 corn and 1/3 soybean rotation. If this rotation is used continuously, the weighted average return has 1/3 of its return from corn-after-soybeans, 1/3 from corn-after-corn and 1/3 from soybeans. The 2/3 corn − 1/3 soybean rotation has an average return of $166 (1/3 �� $197 corn-after-soybean return + 1/3 × $149 corn-aftercorn return + 1/3 × $144 soybean return). As can be seen, the 1/2 corn − 1/2 soybean rotation has a higher return than the 2/3 corn − 1/3 soybean rotation ($171 of return for the 1/2 − 1/2 rotation compared to $166 of return for the 2/3 − 1/3 rotation).
For southern Illinois, budgets in Table 1 suggest that soybeans, having $109 per acre return, are more profitable than corn-after-corn, having $96 per acre return. Soybeans are favored in southern Illinois because corn yields are lower relative to soybean yields in comparison to central Illinois. Using corn-after-soybeans, the cornsoybean yield ratio is 3.3 for southern Illinois compared to 3.5 for central Illinois.
Corn Yield Relative to Soybean Yield
Whether or not planting more corn is economical depends critically on two factors: 1) corn yields relative to soybean yields and 2) yield loss for corn-after-corn. Table 2 illustrates these facts by showing the yield for cornafter- corn that causes a 2/3 corn − 1/3 soybean rotation to have the same average return as a 1/2 corn − 1/2 soybean rotation. If, for example, corn after soybeans yields 150 bushels per acre and soybeans yield 45 bushels per acre, then a corn-after-corn yield of 149 bushels per acre causes a 2/3 corn − 1/3 soybean rotation to have the same return as a 1/2 corn − 1/2 soybean rotation (the fourth line of Table 2). A corn-after-corn yield lower than 149 bushels causes the 1/2 corn − 1/2 soybean rotation to be more profitable. Conversely, a yield above 149 causes the 2/3 corn − 1/3 soybean rotation to be more profitable.
For corn-soybean yield ratios below 4.0, corn-aftercorn must have a yield loss of less than 10% (Table 2). Past agronomic research suggests getting this low of yield loss is questionable. However, it may be possible that some farms have relatively low yield losses. In a study examining why farmers have different corn and soybean profits, farms with higher corn returns than soybean returns had dramatically different corn-soybean yield ratios and lower corn crop costs than farms with higher soybean returns. Results of this study are reported as an Illinois Farm Economics: Facts and Opinions entitled "Corn Returns versus Soybean Returns: Why do Farms Have Different Profits?" (available at http://www.farmdoc.illinois.edu/manage/).
Results in Table 2 depend on prices and costs. Further examination of this topic is provided in an Illinois Farm Economics: Facts and Opinions entitled "The Economics of Adding More Corn to Corn-Soybean Rotations" (available at http://www.farmdoc.illinois.edu/manage/).
Summary
Since 1997, corn returns have increased relative to soybean returns. This increase is primarily due to higher corn yields relative to soybean yields when compared to historic corn-soybean yield levels. Given the relative increase in corn yields, planting more corn may be advisable on some farms whose corn-soybean yield ratios are high and whose corn-after-corn yields are close to corn-after-soybean yields.
More corn may be planted if corn yields continue to be relatively higher than soybean yields. Recent experience in Illinois has corn-soybean ratios that are above the historic 3.2 level. If these ratios increase, corn likely will become more profitable than soybeans.
Another factor that may favor more corn production is changes in relative corn-soybean prices. Analysts suggest that increasing soybean production in South America and loan rate changes in the 2002 Farm Bill suggest a decline in soybean price relative to corn price. This may occur in the future; however, recent prices have not suggested a change in the corn-soybean price relationship.
Farmers should evaluate corn returns versus soybean returns on their individual farms. Calculating cornsoybean yield ratios may be indicative of whether corn or soybeans is more profitable on an individual farm. In addition, calculation of the cost of corn and soybean production is advisable. Farms can have dramatically different production costs. Hence, the advisability of planting more corn and fewer soybeans will vary from farm to farm.
Tables & Figures
| Table
1. 2005 Per acre projected budgets. |
|||||
|---|---|---|---|---|---|
| Corn After Soybeans | Corn After Corn | Soybeans | |||
Central Illinois (High Productivity
Farmland) |
|||||
| Yield | 173 |
156 |
49 |
||
| Price per bu. | $2.25 |
$2.25 |
$5.20 |
||
| Revenue | $389 |
$351 |
$225 |
||
| Variable costs | 192 |
202 |
111 |
||
| Revenue less v.c. | $197 |
$149 |
$144 |
||
Southern Illinois |
|||||
| Yield | 139 |
125 |
42 |
||
| Price per bu. | $2.30 |
$2.30 |
$5.30 |
||
| Revenue | $320 |
$288 |
$223 |
||
| Variable costs | 182 |
192 |
114 |
||
| Revenue less v.c. | $138 |
96 |
$109 |
||
| Table 2. Corn-after-corn yield in a
2/3 corn – 1/3 soybean rotation to break-even with 1/2 corn – 1/2 soybean rotation. |
|||||
|---|---|---|---|---|---|
| Corn-After-Corn | |||||
| Corn-After- Soybean Yield |
Soybean Yield |
Yield Ratio |
Yield | Percent Loss (%) |
|
140 |
40 |
3.50 |
139 |
1 |
|
150 |
40 |
3.75 |
144 |
4 |
|
160 |
40 |
4.00 |
149 |
7 |
|
150 |
45 |
3.33 |
149 |
1 |
|
165 |
45 |
3.67 |
157 |
5 |
|
180 |
45 |
4.00 |
164 |
9 |
|
160 |
50 |
3.20 |
160 |
0 |
|
175 |
50 |
3.50 |
168 |
4 |
|
190 |
50 |
3.80 |
175 |
8 |
|
Given per bushel price of $2.25 for corn
and $5.20 for soybeans
and per acre costs of $192 for corn after soybean, $202 for corn
after corn, and $111 for soybeans.
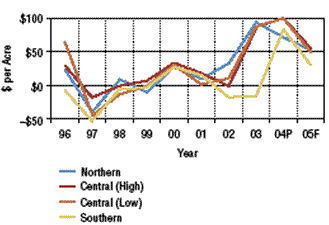 |
Figure 1. Corn
returns minus soybean returns by Illinois region, Illinois FBFM, 1996-2005. |
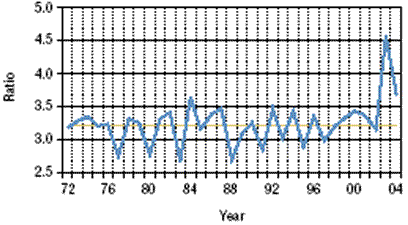 |
Figure 2. Ratio of corn yields
to soybean yields, Illinois, 1972-2004. |